 Support Navi Organizer Service "Support Navi Analyzer"
You can use the application service for supporters as a visualization tool for the tournament.
Supporter/Player/Cheering message/Cheering drum/Cheering counterThank you, everyoneAd analysis visualization
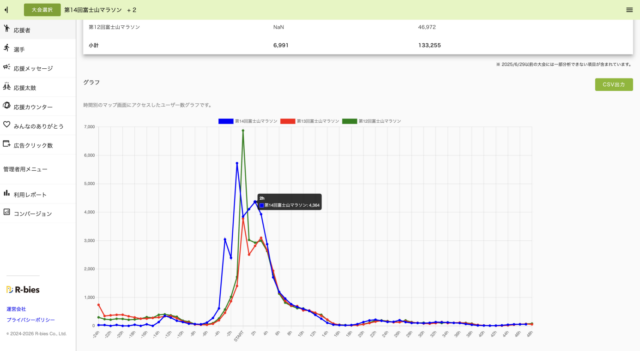
Various usage patterns of Ouen Navi can be analyzed. The excitement of the event can be visualized through analyses such as the Ouen Drum Analysis, and year-on-year comparisons can be easily displayed. Values can also be output as CSV data. *The reference screen shows a graph of user numbers over three years for the Mt. Fuji Marathon.
Visualize the support status as well
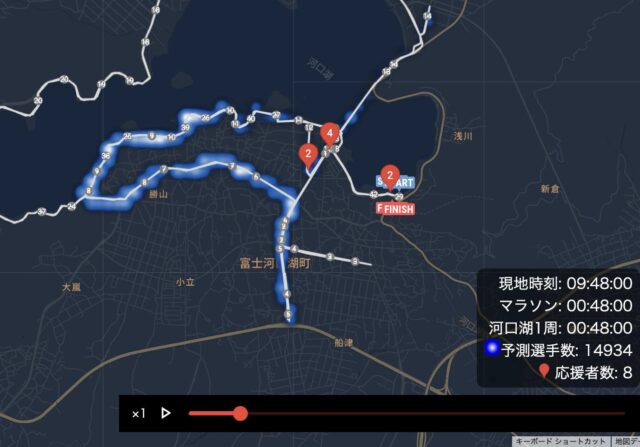
The new service "Cheering Counter," which counts the number of runners you pass, visualizes when and where people tend to cheer by combining it with the runner's position. *The reference screen shows runners in blue and Cheering Counter users in red.
Recommended related articles
-
 2026.02.06Topics
[Runner Public Opinion Poll 2025] Results Announcement: Half Marathon Popularity Rises, 60% of Runners Run 3 or More Days a Week
- Improving the value of a conference
- Improving participant satisfaction
-
 2025.04.22Topics
7 events selected for the first time! "25th National Running Event 100 Selections"
- Improving the value of a conference
- Improving participant satisfaction
- Strengthening event promotion
- Recruitment Announcement & Application
- Event Operations (Day Of)
-
 2025.04.01Topics
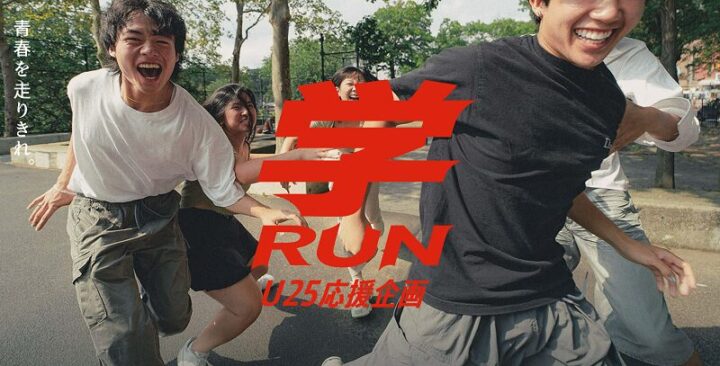
"GakuRun" to start on April 1, 2025!
- Improving the value of a conference
- Improving participant satisfaction
- Strengthening event promotion
- Recruitment Announcement & Application
- Event Operations (Pre-event)
-
 2025.01.22Topics
The Trend of "Returning to Competition" is Clear! Runner Public Opinion Poll 2024 Results Announced
- Improving the value of a conference
- Improving participant satisfaction
-
 2024.08.22Topics
Introducing Ouen Navi's New Feature: "Cheering Counter"
- Improving the value of a conference
- Improving participant satisfaction
- Event Operations (Day Of)
-
 2024.04.24Topics
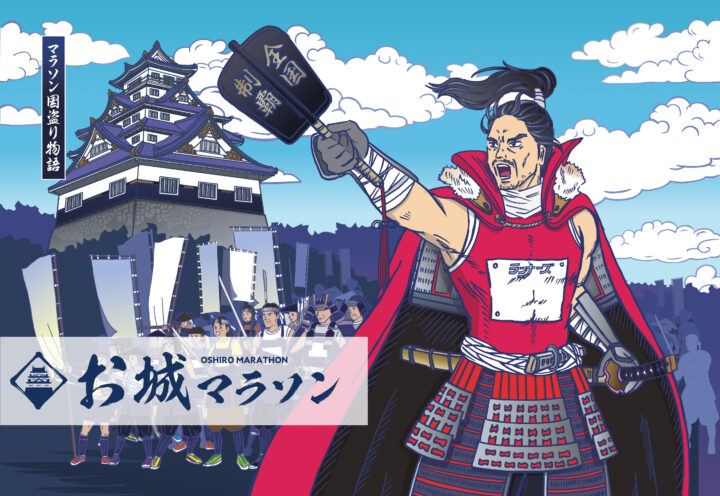
"Castle Marathon 'Sojo' Ranking" Revealed for the First Time!
- Improving the value of a conference
- Improving participant satisfaction
- Strengthening event promotion
- Recruitment Announcement & Application
-
 2024.02.15Topics
Running App TATTA: New Feature Introduction
- Improving the value of a conference
- Improving participant satisfaction
- Online event
-
 2023.04.07Topics
[Customer Acquisition Support] RUNNET Campaign Project "Let's Run Castle Marathons Across Japan (Commonly Known As: Castle Marathon Series)"
- Improving the value of a conference
- Improving participant satisfaction
- Strengthening event promotion
- Recruitment Announcement & Application
Related Services
Use casesEvent Management (Day-of) Follow-upRelated services for Event Organizer available at " "
-
"Everyone's Thank You" Service for Supporters Navi Organizers
- Improving the value of a conference
- Improving participant satisfaction
-
RUNPASS (Vehicle and Pedestrian Crossing Measures)
- Safety and security
-

RUN PASSPORT (Real-time Aggregation App)
- Improving participant satisfaction
- Business efficiency improvement
- Cost reduction
-
Conference Questionnaire
- Improving participant satisfaction
-

Rescue Navi (Marathon Rescue System)
- Safety and security
- Business efficiency improvement
-
Participation fee refund
- Improving participant satisfaction
- Business efficiency improvement
- Cost reduction